This article is designed to take you from a beginner to a confident user of the AMASS Terminal. This tool is built specifically for the “Holy Grail” Setup, a strategy used to find high-probability trades by following big institutional money.
This strategy will work on any trading account platform and assets based on your region (Scalable Capital, Trade Republic, Interactive Brokers, Wealthsimple, Zerodha, eToro, Saxo Bank, etc)
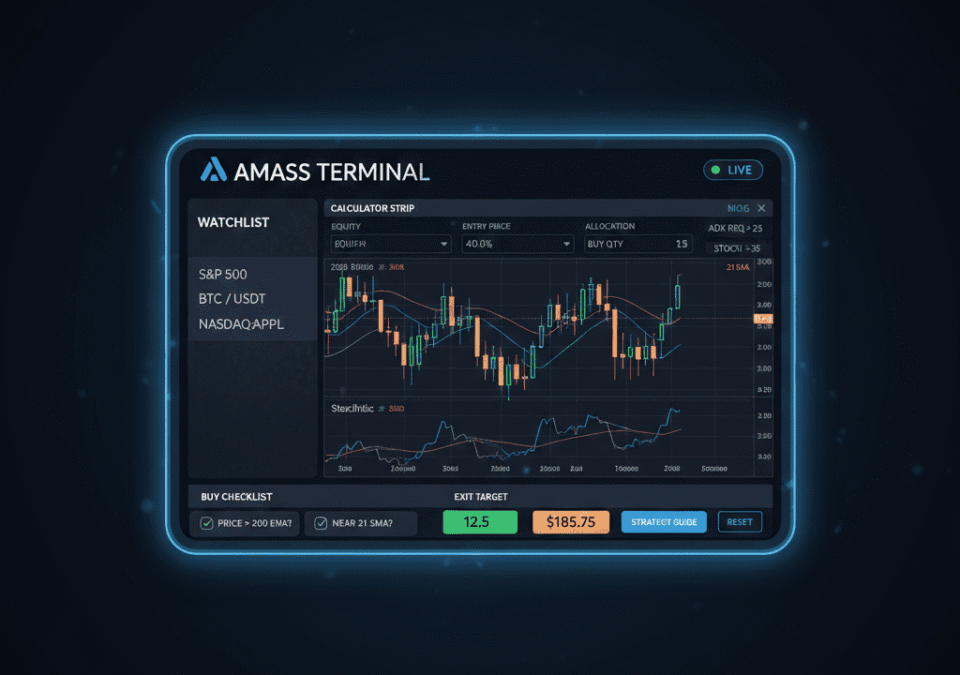
1. Select & Manage Your Assets
Open AMASS Terminal and
Search: Type a symbol (like
AAPLorNASDAQ:AAPLorAPPLE) in the search box and select the asset. Click the ★ button if you want to save it to the Watchlist.Switching: Click any asset in your sidebar to instantly load the chart and recalculate your trade limits.
Timeframe: Use the dropdown (15M, 1H, 4H, 1D). For this strategy, 1H is your primary view for entries.
2. Understanding the Chart (The “Color Code”)
Before you look at the numbers, look at the lines on the AMASS Terminal chart. They are your “Traffic Lights.”
🟡 Yellow Line: This is the Trend. If the price is above this line, the market is healthy and we only look to BUY.
⚪ White Line (Fair Value): This is the Institutional Price. It is the “fair” price that big banks and whales paid. We want to buy as close to this as possible.
🌸 Pink Line: This is the Sweet Spot. When the price drops to touch this line while staying above the Yellow line, it’s like a spring being compressed, ready to jump.
🔵🟠 Blue & Orange Lines: These are at the bottom. They tell us when the market is “tired” or “ready to run.”
3. The “Holy Grail” 6-Step Strategy
Follow these steps in order compound and accumulate wealth.
The Traffic Light: Look at the 1H (1 Hour) chart. Is the price ABOVE the 🟡 Yellow line? If yes, proceed.
Fair Value: Is the price near the ⚪ White line? We don’t want to buy when the price is too far away (overextended).
The Sweet Spot: Wait for the price to dip down and touch or get very close to the 🌸 Pink line.
The Trigger: Look at the bottom box below the chart. Wait for the 🔵 Blue line to cross ABOVE the 🟠 Orange line while they are both at the bottom (below the 20 mark or as calculated in the top bar of the terminal “MOMENTUM 🔵🟠”).
Take Profit: Once you buy, your goal is the Exit Target calculated in the top bar. Or, sell when the Momentum lines reach the very top (above 80).
The Protection (Stop Loss): If the price drops below the lowest point it reached just before you bought, exit immediately to protect your money.
4. Using the Calculator Strip
The terminal does the math so you don’t have to worry about “Position Sizing.”
Your Capital: Type in how much total money is in your trading account (e.g., $1,000).
Entry Price: Type in the current price of the asset you want to buy.
The Outputs:
Allocation: Tells you what percentage of your total money to use for this one trade (e.g., 20%).
Buy Quantity: This is the exact number of shares or coins you should buy.
Exit Target: This is the price where you should sell to take your profit.
5. The Buy Checklist & Signal
As you confirm your steps, check the boxes in the Buy Checklist:
Price > Yellow? (Is the trend up?)
Price Near Pink or White? (Are we buying at a fair price?)
Blue Cross Orange? (Is the momentum starting?)
The Signal Badge:
🔴 NO TRADE: You are missing too many requirements.
🟡 WAITING…: You are close, but wait for the final trigger.
🟢 HIGH PROBABILITY: All systems go. This is a “Holy Grail” setup.
6. The “Nuclear” Reset
If you get confused or want to start a fresh analysis, click the ↺ RESET button.
It clears your entry price.
It resets your capital to 1,000.
It clears all checkboxes and turns the signal back to Red.
It puts the chart back to the 1H view.
Summary for the Layman:
Summary for the Layman: Wait for the price to stay above the Yellow line, dip to the Pink/White lines, and wait for the Blue line at the bottom to cross the Orange. If you see that all criteria are met, then you click the CHECKLIST accordingly, the terminal turns green; that’s your High-Probability signal to follow the Buy Quantity and sell at the Exit Target.
⚠️ Educational content only. Not financial advice. Trading involves risk. Do your own research. Happy Trading 🙂