
The Average Directional Index, or ADX, is a valuable technical indicator used in trading to measure the strength of a trend. It’s a lagging indicator, meaning it reflects past price movements rather than predicting future ones.
ADX is the “speedometer” of the trading world. While most indicators tell you where the price is going, the ADX tells you how fast it’s getting there.
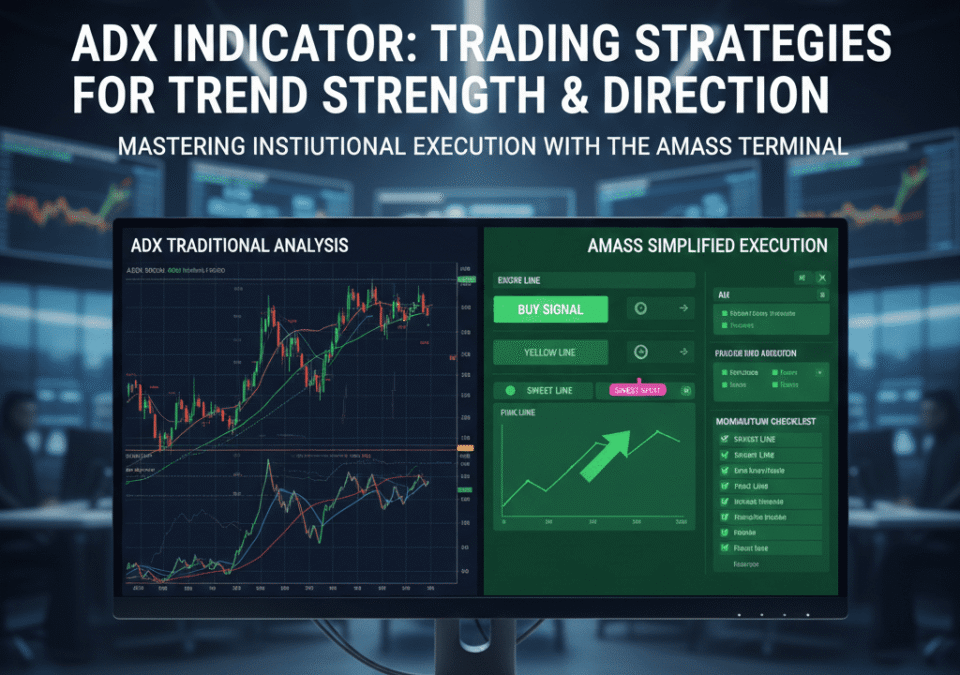
However, as a lagging indicator, the ADX tells you what the whales did five minutes ago. For traders who want to combine traditional trend strength with real-time institutional execution, tools like the AMASS Terminal have become the modern standard for identifying the “Sweet Spot” before the ADX even catches up.
Understanding the ADX Indicator
What is the ADX Indicator?
The ADX indicator is a technical analysis indicator designed to measure trend strength. Developed by Welles Wilder, it is displayed as a single line that oscillates between 0 and 100. The ADX measures the strength of the trend, regardless of its direction. Therefore, the ADX line will rise whether the trend is up or down. Traders use the ADX to identify strong trends and avoid trading in weak or directionless markets. The ADX indicator trading strategies can be applied to various markets and timeframes, making it a versatile tool for different trading styles.
The ADX is a technical oscillator that measures the strength of a trend, regardless of its direction. It oscillates between 0 and 100:
0–25: Absent or weak trend (Trading here is often “death by a thousand cuts”).
25–50: Strong trend.
50–100: Extremely strong/Overextended trend.
How the Average Directional Index Works
The average directional index (ADX) works by quantifying the strength of a trend using the directional movement index (DMI). The DMI consists of two components: the positive directional indicator (+DI) and the negative directional indicator (-DI). The ADX combines these values to measure trend strength. When the +DI is above the -DI, it suggests an uptrend, while the opposite indicates a downtrend. The ADX value then measures the strength of this trend, regardless of direction, providing traders with insights into the momentum behind price movements. Traders use ADX to help traders make informed trading decisions.
Calculating the ADX Reading
Calculating the ADX reading involves a series of steps, primarily involving the calculation of a few key values:
- First, you need to determine the directional movement (+DM and -DM) by comparing the current high and low prices with the previous period’s high and low, and calculate the +DI and -DI using these directional movements.
- Next, smooth these values using a moving average, typically over 14 periods.
- Finally, the ADX is calculated using a formula that combines the smoothed +DI and -DI values.
This calculation results in the ADX line, which oscillates between 0 and 100, providing a measure of the strength of a trend. Traders often use ADX values to confirm trend direction and strength, combining ADX with other indicators for enhanced trading signals. When ADX above 25 indicates a strong trend.
+DI (Positive Directional Indicator): Measures upward pressure.
-DI (Negative Directional Indicator): Measures downward pressure.
When the +DI is above the -DI, the bulls are in control. When the -DI is on top, the bears are driving. The ADX line itself simply measures the “gap” between these two; the wider the gap, the stronger the trend.
Technical Accuracy: Calculating the ADX
To truly understand the “lag” in ADX, you have to look at the math. The ADX is a smoothed average of the Directional Index (DX).
The Insight: Because of this double-smoothing, the ADX can be slow to react to sudden institutional moves. This is why professional traders use the AMASS Terminal to spot the Yellow Line (Trend) and Pink Line (Sweet Spot)—it provides the “Why” behind the move before the math catches up.
Trading Strategies Using the ADX
Introduction to ADX Trading Strategies
The ADX indicator is a versatile technical indicator, and several effective trading strategies revolve around its use. The primary purpose of the ADX indicator is to measure the strength of a trend, helping traders determine whether a market trend is strong enough to warrant a trade. These ADX trading strategies can be adapted for various trading styles, including day trading and swing trading. The ADX indicator trading strategies often involve combining the ADX with other technical analysis tools to generate high-probability trade signals. Understanding how to use the ADX effectively can significantly enhance trading decisions and improve the overall performance of trading strategies. If the ADX is above 25, it indicates a strong trend.
Swing Trading with the ADX Indicator
For swing trading, the ADX can be particularly valuable in identifying potential swing trading opportunities. Swing traders aim to capture profits from short-term price swings within a larger trend. To use the ADX in swing trading, traders look for stocks or assets where the ADX reading is rising, indicating increasing trend strength. A rising ADX suggests that the current trend is likely to continue, presenting an opportunity for swing traders to enter a trade in the direction of the trend. Swing trading with the ADX often involves using other indicators to confirm entry and exit points, but the ADX indicator provides crucial information about the strength of the trend and the potential for a profitable swing. The strength of a trend can be the most important thing to acknowledge. If the ADX is above 20, we can say it is a strong trend. Traders use the ADX to enhance their swing trading.
Swing Trading: Hunting the Trend
Swing traders look for the “Momentum Ignite.” A rising ADX (especially crossing above 20) suggests a trend is born.
Strategy: Wait for ADX > 20 and a +DI/-DI cross.
The Upgrade: Instead of waiting for the ADX to climb, the AMASS Terminal uses a 6-Step Strategy to find “High Probability” signals at the very start of the swing, ensuring you aren’t buying at the top of an ADX peak.
Day Trading: Enhancing Your Strategies with ADX
In day trading, where decisions are made rapidly, the ADX can help traders quickly assess the strength of a trend and make informed trading decisions. Day traders use the ADX to identify trending market conditions and avoid trading during periods of consolidation or weak trend. When the ADX line is above 25, it suggests a strong trend, which can be a valuable signal for day traders looking to capitalize on short-term price movements. Combining the ADX with other indicators, such as moving averages or oscillators, can enhance the accuracy of trade signals and improve the effectiveness of day trading strategies. However, day traders should be cautious when the ADX is low, as it may indicate a weak trend or a ranging market, which can lead to false trade signals. The average directional index helps traders.
Day Trading: Avoiding the “Chop”
In day trading, the ADX is a filter. If the ADX is below 25, the market is likely ranging.
Pro Tip: If the ADX is flat or falling, stay out. Wait for the ADX to “hook” upward.
Combining the ADX with Other Indicators
Effective ADX Strategies
To enhance the effectiveness of ADX trading strategies, it is often beneficial to combine the ADX indicator with other technical analysis tools. By using the ADX indicator in conjunction with other indicators, traders can gain a more comprehensive view of market conditions and improve the accuracy of their trading decisions. This combination approach can help traders confirm the strength of a trend indicated by the ADX, as well as identify potential entry and exit points. Effective ADX strategies typically involve using the ADX to gauge the strength of a trend and then employing other indicators to fine-tune trade entries and exits. The combination of the ADX with other technical tools can lead to more robust and reliable trading strategies. Remember, if the ADX is above 25, it indicates a strong trend.
Trading with the ADX and Moving Averages
One popular strategy involves combining the ADX with moving averages. Moving averages help to smooth out price data and identify the direction of the trend. When the ADX indicates a strong trend, traders can use moving averages to confirm the trend direction and identify potential entry points. For example, if the ADX shows increasing trend strength and the price is trading above its 200-day moving average, it may signal a potential buying opportunity. Conversely, if the ADX is above 25 indicating a strong trend and the price is trading below its 200-day moving average, it may signal a selling opportunity. Combining the ADX with moving averages provides traders with a clearer picture of both trend strength and direction, enhancing the effectiveness of their trading strategies. Traders use ADX to make enhanced decisions.
ADX + Moving Averages
This is the “Golden Combo.” Moving averages provide the direction, while ADX provides the permission.
Buy Signal: Price > 200 EMA + ADX > 25 + Blue Momentum Line (from AMASS) crossing Orange.
Why this works: It ensures you are trading with the trend, with strength, and with momentum.
Using ADX Signals for Better Decision Making
ADX signals can significantly improve trading decisions by providing traders with insights into the strength of a trend. A rising ADX line indicates increasing trend strength, suggesting that the current trend is likely to continue. This information can help traders decide whether to enter a trade in the direction of the trend or to hold onto existing positions. Conversely, a falling ADX line indicates decreasing trend strength, which may signal a potential trend reversal or a period of consolidation. By monitoring the ADX signals, traders can avoid trading in weak or directionless markets and focus on opportunities where there is a strong and well-defined trend. These signals provide traders with the information they need to make informed trading decisions. Day trading is a strategy where these signals help.
ADX + Price Action (The Institutional Strategy)
The most advanced traders look for Divergence. If the price makes a new high, but the ADX makes a lower high, the trend is losing steam. This is often a sign that institutions are distributing their positions to retail “bag holders.”
Advanced Techniques for Using the ADX Indicator
Using the ADX Indicator in Trend Reversals
While the ADX indicator is primarily used to measure trend strength, it can also provide valuable insights into potential trend reversals. One way to use the ADX in trend reversals is to look for divergences between the ADX line and price action. For example, if the price is making new highs but the ADX is failing to make new highs, it may signal a weakening trend and a potential reversal. Additionally, a sharp decline in the ADX value can indicate that the current trend is losing momentum and a reversal may be imminent. By monitoring the ADX indicator for these types of signals, traders can anticipate potential trend reversals and adjust their trading strategies accordingly. ADX signals can give traders a better look into the market.
Combining ADX with Price Action
Combining the ADX with price action analysis can be a powerful way to improve the accuracy of trade signals. Price action involves analyzing the movement of prices over time to identify patterns and potential trading opportunities. When the ADX indicates a strong trend, traders can use price action techniques to identify specific entry and exit points. For example, if the ADX is above 20 showing increasing trend strength, traders may look for bullish candlestick patterns, such as engulfing patterns or pin bars, to confirm potential buying opportunities. Combining the ADX with price action analysis allows traders to align their trades with both the strength and direction of the trend, enhancing the probability of success. Traders use the ADX to make enhanced decisions.
Maximizing Returns: From ADX to AMASS Terminal
To maximize returns by using the ADX indicator, traders should focus on identifying strong trends and capitalizing on high-probability trading opportunities. The ADX indicator trading strategies can be optimized by combining the ADX with other technical analysis tools, such as moving averages, trendlines, and oscillators. Additionally, traders should pay close attention to risk management principles, such as setting stop-loss orders and managing position sizes, to protect their capital. It’s also important to remember if the ADX is above 25, it indicates a strong trend. By consistently applying these techniques and refining their trading strategies over time, traders can maximize their returns and achieve greater success in the financial markets. Traders use the ADX to make enhanced decisions.
While the ADX is a great foundational tool, it doesn’t help you with the hardest part of trading: Position Sizing and Exit Targets.
This is where the AMASS Terminal bridges the gap. While you use the ADX to gauge the macro-strength, the AMASS Terminal handles the micro-execution:
The Traffic Light: Confirms the ADX trend strength instantly.
The Calculator Strip: Tells you exactly how many shares to buy so you don’t blow your account.
The Exit Target: Mathematically identifies where the “Smart Money” will likely take profits.
Final Thoughts
The ADX is your compass, but the AMASS Terminal is your GPS and engine. By using the ADX to identify a strong market and the AMASS checklist to time your entry, you stop being a “retail target” and start trading like an institution.