
Swing trading presents an appealing approach for individuals seeking to capitalize on short-term price fluctuations in the market. This article explores the world of swing trading indicators and equips you with the knowledge to make informed trading decisions. Discover the best swing trading indicators and how they can enhance your trading strategies. Let’s dive in!
Understanding Swing Trading
What is Swing Trading?
Swing trading is a trading strategy centered around capturing price ‘swings’ in the stock market, typically over a short to medium timeframe. Unlike day trading, which requires constant monitoring and frequent trades within a single day, swing trading involves holding positions for a few days to weeks, allowing swing traders to profit from anticipated price movements. It’s particularly suitable for individuals who can’t monitor the market continuously but still want to benefit from potential gains. The core idea is to identify stocks expected to experience significant price movement and hold them until the swing concludes, securing profits from the difference between entry and exit points. The effectiveness of swing trading relies heavily on selecting appropriate swing trading indicators and understanding market trends.
Characteristics of a Successful Swing Trader
A successful swing trader possesses a blend of analytical skills, discipline, and risk management expertise. They demonstrate proficiency in technical analysis, using indicators for swing trading to identify potential entry and exit points. These traders are adept at interpreting price action and recognizing patterns that suggest potential breakouts or reversals. Furthermore, a successful swing trader has a well-defined trading plan, outlining their swing trading strategies, risk tolerance, and profit targets. They stick to their plan, avoiding impulsive trading decisions based on emotions. Effective money management is crucial, as is the ability to cut losses quickly and let profits run. Many swing traders also incorporate fundamental analysis to complement their technical analysis, gaining a deeper understanding of the companies they are trading.
Benefits of Swing Trading
Swing trading offers several benefits that appeal to a wide range of traders. These advantages include:
- Less intensive monitoring compared to day trading, making it suitable for individuals with other commitments. Swing traders can analyze the market and set up their trades, without needing to watch price movement constantly.
- Capitalization on both upward and downward price trends. By identifying potential reversals, swing traders can profit from both bullish and bearish market conditions.
- The potential for substantial profits within a relatively short timeframe. By capturing significant price swings, traders can achieve higher returns compared to longer-term investment strategies.
Furthermore, swing trading can be applied to various markets, including stocks, forex, and commodities, providing diverse opportunities for profit. Utilizing effective indicators for swing trading is paramount to maximizing these benefits and achieving successful swing trades.
Key Swing Trading Indicators
Overview of Best Indicators for Swing Trading
Indicators play a crucial role in swing trading by providing insights into share market trends, momentum, and potential reversal points. Several indicators can assist swing traders in making informed trading decisions. Among the best indicators for swing trading are moving averages, which help smooth out price data and identify the overall trend. The Relative Strength Index (RSI) is a momentum indicator that signals potential overbought or oversold conditions. MACD (Moving Average Convergence Divergence) is another popular choice, as it identifies potential trend changes. Bollinger Bands provide insights into price volatility and potential breakout points. While the best indicators for swing trading are subjective and depend on individual preferences, understanding how these indicators work can significantly enhance a swing trader’s strategies.
Technical Indicators for Swing Trading
Technical indicators for swing trading fall into three main categories. These categories help traders analyze different aspects of price action, and include:
- Trend indicators, like moving averages (both simple and exponential), which show the overall direction of a stock and help smooth out noise.
- Momentum indicators, such as the RSI, which reveal how strong a trend is and whether it’s at risk of reversing, helping traders spot potential entry and exit points.
- Volume indicators, which measure how many traders are participating in a move, confirming whether a trend has real strength behind it.
Other useful indicators include MACD (Moving Average Convergence Divergence), Bollinger Bands, the Stochastic Oscillator, Average True Range (ATR), and Fibonacci retracements, all of which can be used in swing trading to identify potential trading opportunities. Choosing the right swing trading indicator is crucial for successful swing trades.
Oscillators and Their Role in Swing Trading
Oscillators play a vital role in swing trading by providing insights into the momentum of price movements. The RSI, displayed as an oscillator, is a popular tool used to determine where a stock falls on a range from 0 to 100, helping traders identify potential overbought or oversold conditions. When the RSI reaches high levels (typically above 70), it suggests the stock may be overbought and due for a pullback, while low levels (typically below 30) indicate potential oversold conditions and a possible bounce. The Stochastic oscillator is another momentum indicator that can be used to confirm trends or identify potential reversals. By analyzing these oscillators, swing traders can gain valuable insights into price action and make more informed trading decisions, increasing the likelihood of successful swing trades. These indicators every trader should know can greatly improve trading strategy.
Strategies and Indicators for Successful Swing Trades
Developing a Swing Trading Strategy
Developing a sound swing trading strategy is critical for success, and it often involves combining multiple indicators for swing trading to improve accuracy. Relying solely on a single indicator can be misleading, as market conditions are complex and multifaceted. Therefore, swing traders should consider integrating trend-following indicators, such as the moving average, with momentum indicators, like the RSI, to gain a more comprehensive view of potential trade opportunities. This approach allows traders to confirm signals and reduce the likelihood of false positives, ultimately enhancing the effectiveness of their swing trading strategies. By combining different types of technical indicators, traders can filter out noise and focus on high-probability swing trades.
Using Moving Averages as a Trading Tool
A moving average is a technical indicator used in swing trading to smooth out price movement by creating a constantly updated average price. It aids in identifying trends and potential reversal points in the stock market, offering valuable insights for swing traders. Two common types are the Simple Moving Average (SMA) and the Exponential Moving Average (EMA). The SMA calculates the average price over a specified number of past periods, while the EMA assigns more weight to recent prices, making it more sensitive to price movement. To utilize the moving average effectively, traders often look for crossovers, where a shorter-term moving average crosses above a longer-term one, signaling a potential buy signal, or crosses below, indicating a sell signal. Many swing traders consider the moving average one of the best swing trading indicators due to its simplicity and effectiveness in confirming trends. However, it is a lagging indicator, so it’s best used in swing trading for confirmation rather than prediction.
Relative Strength Index (RSI) in Swing Trading
The Relative Strength Index (RSI) is a momentum indicator that measures the speed and change of price movement, making it an essential tool for swing traders. This oscillator ranges from 0 to 100 and helps determine whether a stock is overbought or oversold. An RSI reading above 70 suggests overbought conditions, indicating that the stock may be overpriced and prone to a reversal. Conversely, an RSI below 30 signals oversold conditions, implying that the stock may be undervalued and poised for a potential bounce. Swing traders often use the RSI in conjunction with trend analysis to confirm potential entry and exit points, enhancing the probability of a successful swing trade. A pure momentum indicator, the RSI has become a crucial part of every swing trading strategy. By monitoring the RSI, swing traders can make better trading decisions and capitalize on short-term price movement.
The Best Indicators for Swing Trading in a Single System
Swing trading is often called the “sweet spot” of the financial markets. Unlike day trading, which requires constant screen time, or long-term investing, which requires years of patience, swing trading allows you to capture significant price moves over days or weeks.
However, the secret to success isn’t just “trading more”—it’s about using the right indicators for swing trading to identify high-probability setups. In this guide, we’ll break down the essential tools every swing trader needs and show you how to simplify your entire workflow using the AMASS Terminal.
1. The Trend Filter: Moving Averages (EMA & SMA)
The first rule of swing trading is: The trend is your friend. Most swing traders use the 50-day and 200-day moving averages to determine market direction.
The Strategy: Only look for “Buy” opportunities when the price is above the long-term average.
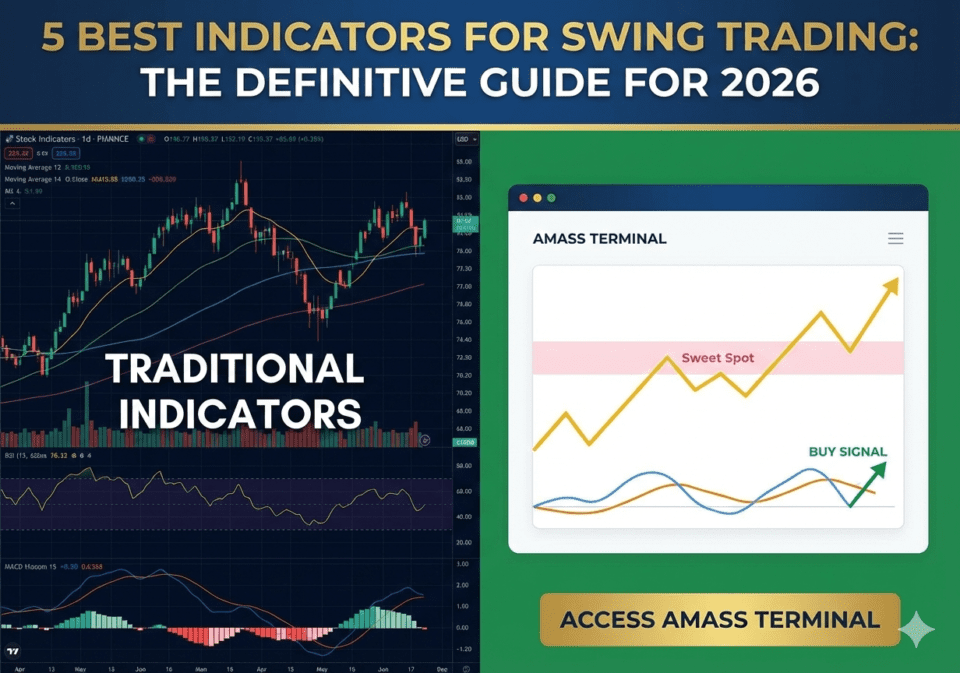
The AMASS Upgrade: Instead of cluttering your chart with multiple lines, the AMASS Terminal utilizes a proprietary Yellow Line. This acts as a definitive trend filter—if the price is above the Yellow, the “Traffic Light” is green, and you are cleared to look for entries.
2. The Value Finder: Relative Strength Index (RSI)
To make money in a swing, you need to buy low and sell high. The RSI helps you identify when an asset is “oversold” (cheap) or “overbought” (expensive).
The Strategy: Look for an RSI below 30 for potential entries.
The Problem: RSI can stay oversold for a long time during a crash, leading to “falling knife” traps.
3. The “Sweet Spot”: Institutional Fair Value
Traditional indicators like Bollinger Bands try to find value, but they often miss where the “Smart Money” is actually buying.
The Modern Solution: Professional swing traders look for Institutional Fair Value. In the AMASS Terminal, this is represented by the White Line (Fair Value) and the Pink Line (The Sweet Spot). When price dips to these levels while remaining in an uptrend, you have found the highest-probability entry point possible.
4. Momentum Confirmation: MACD or Stochastics
Once you find a trend and a value price, you need a “trigger” to enter the trade. You don’t want to buy while the price is still dropping; you want to buy as it starts to turn back up.
The Strategy: Wait for a “Bullish Crossover” on the MACD.
The AMASS Upgrade: The terminal features a dedicated Momentum box where the Blue Line crosses the Orange Line. When this happens at the bottom of the range, it provides a mathematical “Go” signal, removing the guesswork from your execution.
5. The Volume Profile: Tracking the Whales
Volume confirms the strength of a move. A price jump on low volume is often a trap. Swing traders look for “Volume Spikes” to confirm that institutions are moving into a position.
Why “Indicator Overload” Kills Profits
Most beginners add all five of these indicators to a single TradingView chart. The result? Analysis Paralysis. One indicator says “Buy,” another says “Wait,” and the trader ends up doing nothing—or worse, making an emotional mistake.
The Solution: The AMASS Terminal (All-in-One Swing System)
The AMASS (Adaptive Multi-Asset Swing System) was built specifically to solve the problem of messy charts. It takes the logic of the best indicators for swing trading and combines them into a streamlined, 6-step terminal.
How it works in 30 seconds:
Check the Trend: Is the price above the Yellow Line?
Find the Value: Is the price touching the Pink/White Lines?
Confirm Momentum: Is the Blue Line crossing the Orange?
Execute: Use the built-in calculator to get your exact Buy Quantity and Exit Target.
Explore the AMASS Terminal Here
Best Practices for Swing Traders
Analyzing Market Trends Using Technical Analysis
Swing trading leverages technical analysis, chart patterns, and market insights to capture short-term price movement. Technical indicators transform price movement and trading volume data into easily interpretable signals. Stock chart patterns offer visual cues for price action, assisting traders in spotting profitable opportunities. By employing indicators like moving averages, RSI, and Fibonacci Retracement, along with mastering patterns like Head and Shoulders, traders can enhance their trading decisions and results. This reliance on technical indicators sets swing trading apart from other trading strategies, making it essential for swing traders to develop a strong understanding of technical analysis and chart patterns to make informed trade decisions. Selecting the best indicators for swing trading depends on a trader’s individual trading strategy.
Risk Management in Swing Trading
The 1% rule, a crucial element of risk management in swing trading, entails risking only 1% of one’s trading capital per trade. This rule protects traders from significant losses and ensures survival in the market, even after multiple losing trades. It’s essential to adapt indicators based on current market conditions, especially during volatile periods, using tools like ATR or widening Bollinger Bands for better risk control. A higher ATR suggests wider stops, while a low ATR indicates tighter price movement. Even with the best swing trading indicators, losses are inevitable, making risk management paramount. This disciplined approach to risk management, which limits potential losses in each trade, is essential for long-term success as a swing trader. Remember, successful swing trading strategies always include a robust risk management plan.
Common Mistakes to Avoid in Swing Trading
One common mistake in swing trading is overcomplicating the trading strategy by using too many technical indicators, which can lead to confusion and delayed trading decisions. It’s advisable to stick to 2-3 key indicators that work well together, like pairing MACD with Bollinger Bands, to keep the analysis simple and focused. Too many indicators can cause conflicting signals and slow down decision-making. Selecting the best indicators for swing trading and using them effectively can streamline the swing trading process and increase the likelihood of successful swing trades. Novice swing traders sometimes believe that using many technical indicators will improve their trading strategy, when this will more likely result in paralysis by analysis.
Conclusion: Your Guide to the Best Swing Trading Indicators
Recap of Effective Swing Trading Indicators
Effective indicators for swing trading are crucial for making informed decisions. These include a variety of tools, such as:
- Moving averages, which reveal whether a stock is trending up, down, or sideways, providing essential insights into overall market direction.
- Tools such as the Relative Strength Index (RSI), which measure the strength and speed of stock price movement and help spot overbought or oversold conditions, signaling potential reversal points.
- MACD.
Each of these indicators provides unique information that, when used together, can improve the accuracy and profitability of swing trades. Swing traders use these indicators to confirm entry and exit points, making informed trading decisions based on market analysis. Understanding how to use the best indicators for swing trading is paramount to successful swing trades.
Next Steps for Aspiring Swing Traders
Aspiring swing traders should practice with demo accounts to test indicators in real market conditions and keep a trading journal to track your trades. Simulate different trends to fine-tune your trading strategy and build confidence. Keep a trading journal to track your trades, including entry and exit points and indicators used. Regularly review your journal to spot patterns and improve your trading strategy. This hands-on approach, coupled with continuous learning, is essential for mastering swing trading strategies and achieving consistent results. Demo accounts allow swing traders to experiment with various technical indicators and refine their trading plans without risking real capital. By carefully documenting each trade, traders can identify strengths and weaknesses in their approach, leading to continuous improvement and more successful swing trades.
Resources for Further Learning
The information provided in this article is for educational purposes only and should not be considered financial advice. Before engaging in swing trading or any other form of trading, consult with a qualified financial advisor to assess your risk tolerance and financial goals. Remember that swing trading involves risk, and it’s possible to lose money. This article does not contain a recommendation to buy or sell any securities. Additional resources such as books, online courses, and webinars can provide further insights into technical analysis and swing trading strategies. Continuously educating yourself and staying informed about market trends is crucial for long-term success as a swing trader. Staying informed on technical indicators is an ongoing process, as technical analysis and the markets are always changing.