Which Indicator Gives Best Buy and Sell Signals
Finding the perfect entry and exit point is the difference between a professional trader and a hobbyist. While TradingView offers thousands of tools, most retail traders struggle with “Indicator Overload”—a cluttered chart that provides conflicting signals, leading to analysis paralysis.
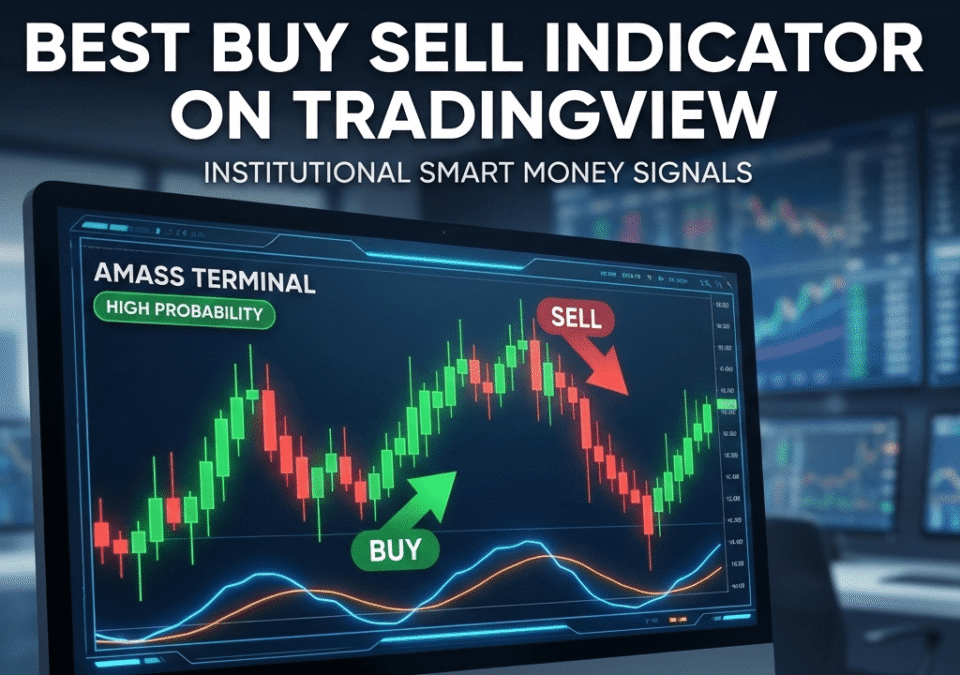
This guide explores traditional technical indicators and introduces the AMASS Terminal, a revolutionary evolution that simplifies institutional-grade analysis into a single, executable dashboard.
Understanding Indicators on TradingView
What is a Buy Sell Indicator?
A Buy/Sell indicator is a visual tool that analyzes historical price action and volume to suggest potential market turning points. However, most indicators are lagging, meaning they tell you what happened in the past rather than what is happening right now.
Importance of Trading Indicators
Indicators serve three primary purposes:
-
Alert: To draw your attention to a potential setup.
-
Confirm: To validate a price action thesis (e.g., a breakout).
-
Predict: To estimate future price targets based on momentum.
Overview of TradingView Indicators
TradingView provides a massive library of built-in and community-scripted indicators. While powerful, the “Best” indicator isn’t just the one that produces the most signals, but the one that produces the highest probability signals with the least amount of noise.
Top Buy and Sell Indicators (The “Old School” Foundation)
Before moving into advanced systems, every trader must understand the three pillars of standard technical analysis.
1. MACD: Moving Average Convergence Divergence
MACD is a trend-following momentum indicator. It shows the relationship between two moving averages of a security’s price.
-
-
The Signal: A “Buy” is typically generated when the MACD line crosses above the signal line.
-
2. RSI: Relative Strength Index
RSI is a momentum oscillator that measures the speed and change of price movements.
-
The Signal: Traditional theory suggests that an RSI below 30 is “Oversold” (Buy) and above 70 is “Overbought” (Sell).
3. Stochastic Oscillator
Similar to RSI, the Stochastic Oscillator compares a specific closing price of a security to a range of its prices over a certain period of time. It is faster than RSI and excels in range-bound markets.
The Evolution: Why Traditional Indicators Often Fail
Most retail traders fail because they use these tools in isolation. A “Buy” signal on the RSI might occur while the overall trend is bearish, leading to a “Stop-Hunt.”
This is where the AMASS (Adaptive Multi-Asset Swing System) Terminal changes the game. Instead of looking at a single line, it analyzes the “Consensus” of the market.
AMASS Terminal: The Professional Alternative
The AMASS Terminal acts as a filter for TradingView data. It moves beyond simple crossovers by focusing on Institutional Flow.
-
The Traffic Light (Yellow Line): Instantly tells you if the trend is healthy.
-
The Sweet Spot (Pink Line): Identifies exactly where “Smart Money” is likely to buy.
-
The Buy Checklist: A built-in logic system that prevents you from taking low-probability trades.
Comparison: Standard Indicators vs. AMASS Terminal
| Feature | Standard Indicators (MACD/RSI) | AMASS Terminal |
| Complexity | High (Requires manual interpretation) | Low (Step-by-step checklist) |
| Accuracy | Prone to “False Positives” | High-Probability (Institutional focus) |
| Risk Management | Usually manual calculation | Automated Position Sizing & Targets |
| Speed | Often Lagging | Real-time “Sweet Spot” identification |
Technical Analysis with Buy Sell Indicators
Integrating Multiple Indicators
The most successful strategies involve Confluence. For example, you might only take a MACD “Buy” if the price is also touching a major supply/demand zone.
Using the Aroon Indicator for Trend Analysis
The Aroon indicator is used to identify trend changes. Combining Aroon with the AMASS Yellow Line (Trend Indicator) provides a double-confirmation that a new bull cycle has started.
Combining Oscillators for Enhanced Strategies
By combining the Stochastic Oscillator with the AMASS Momentum Lines (Blue/Orange), you can pinpoint the exact moment momentum shifts from the bottom (below the 20 mark) to create an explosive entry.
How to Implement the Best Buy Sell Strategy
-
Open your Chart: Load your preferred asset on TradingView (1H timeframe is recommended for swing trading).
-
Verify the Trend: Ensure price is above the Yellow Line.
-
Wait for the Dip: Look for the price to touch the Pink (Sweet Spot) or White (Fair Value) lines.
-
Check Momentum: Wait for the Blue line to cross the Orange line below the 20 mark, or for the automatically calculated value in the checklist based on the asset selected.
-
Execute: Use the AMASS Calculator to determine your Buy Quantity based on your capital.
Conclusion: Choosing the Best Buy Sell Indicator
The “Best” indicator is ultimately the one that removes emotion from your trading. While MACD and RSI are excellent for learning the basics, they lack the integrated risk management and institutional logic required for long-term wealth accumulation.
For traders looking to stop being the “Exit Liquidity” for big banks, the AMASS Terminal offers a streamlined, professional-grade solution that turns complex technical analysis into a simple, 6-step execution.
Final Thought: Don’t chase signals; follow the money.